Web Console Operation Guide
Doc Version: 1.0.0 Last Updated: 2026-09-15 Applicable Version: v3.1.1 Author: Lincoln
This guide is for first-time users of the JAiRouter Web Console, covering everything from login to connecting your first model service, quota management, observability, and access control.
1. Login and First Launch
1.1 Access URL
| Deployment | URL | Notes |
|---|---|---|
| Local dev (Vite) | http://localhost:3000/admin | Vite dev server, hot reload |
| Production / standalone | http://<host>:8080/admin | Backend-served SPA |
Both entry points serve the same frontend code with identical functionality.
1.2 Default Accounts
| Username | Default Password | Role | Description |
|---|---|---|---|
admin | ChangeMeOnFirstStartup123456 | ADMIN, USER | Super admin with all 48 permission codes |
user | user123456 | USER | Regular user, primarily read-only |
⚠️ Change the
adminpassword before first production use. The password is set via theINITIAL_ADMIN_PASSWORDenvironment variable (seesrc/main/resources/config/auth/jwt.yml). Restart the service after changing it.
# Example: set the environment variable before startup
export INITIAL_ADMIN_PASSWORD="YourStr0ngPassword#2026"
1.3 Token Storage
After a successful login, the JWT is stored in the browser localStorage under the key admin_token.
⚠️ Do not inject tokens manually. The frontend route guard (
router.beforeEach) performs the following checks on every navigation:
- Checks whether
admin_tokenexists inlocalStorage;- Decodes the JWT to verify expiration (marked expired 60 seconds early);
- Validates that the route's
meta.roles/meta.permissionsrequirements are met.Only when all conditions pass is navigation allowed; otherwise the user is redirected to
/login. A manually written token that is expired or missing thepermissionsclaim will prevent the console from functioning properly.
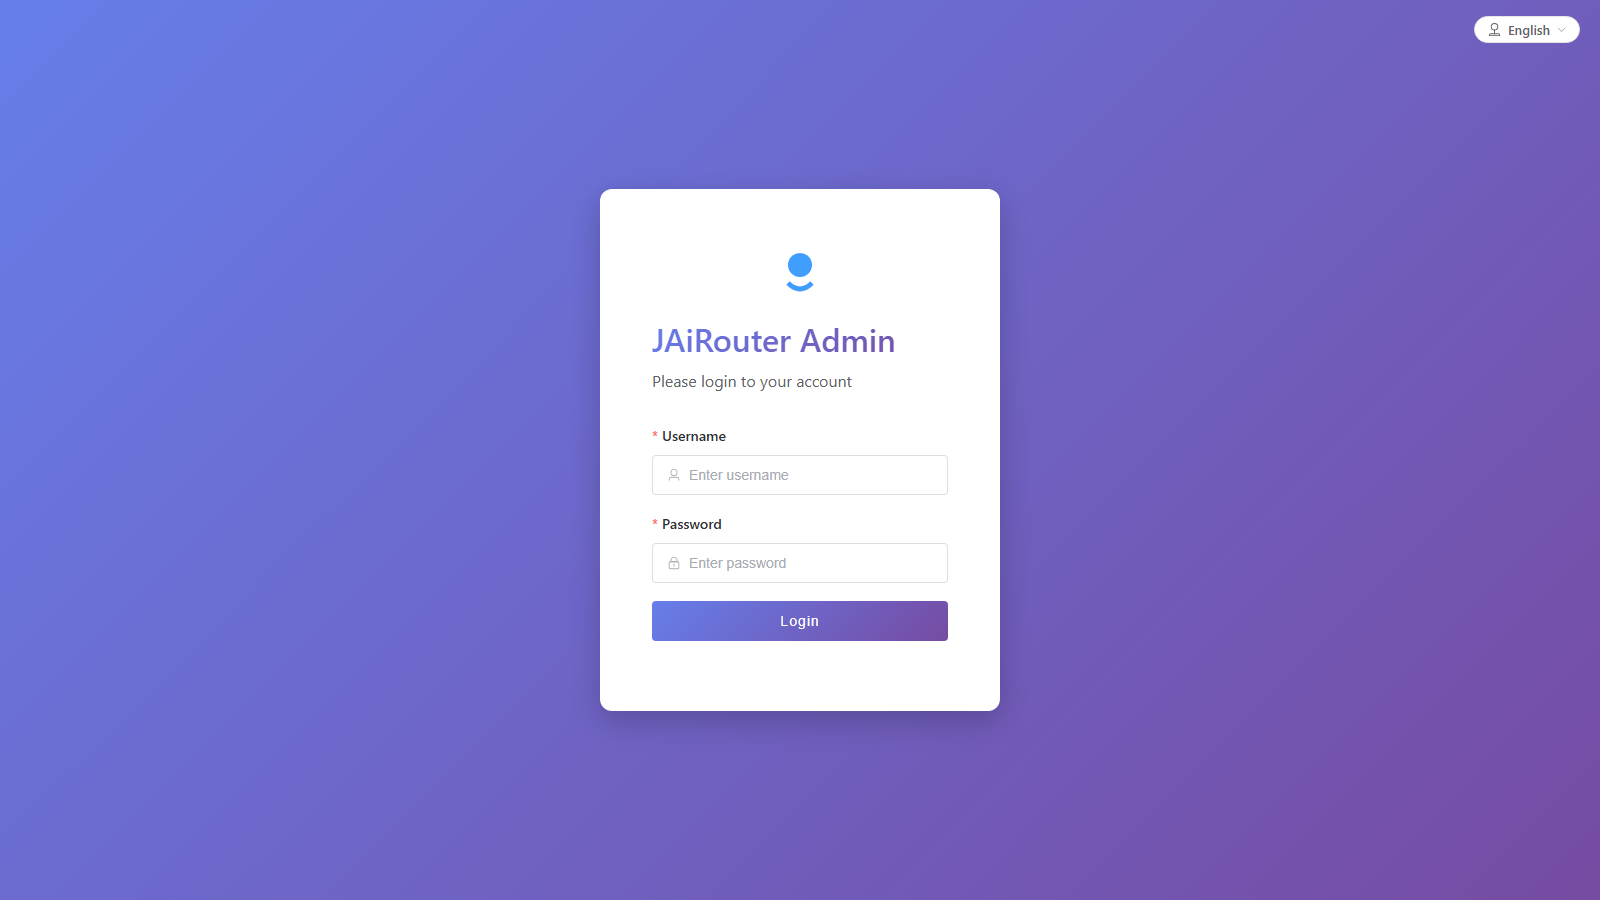
1.4 Login Flow
- Open the console URL in a browser;
- The page title displays JAiRouter Admin (zh: JAiRouter 管理后台);
- Enter your username and password, then click the Login button;
- On success, you are automatically redirected to the Dashboard page.
2. Interface Layout
2.1 Left Navigation
The console has a collapsible sidebar containing 9 menu groups with a total of 39 pages. Menu visibility is controlled by permission codes — groups and pages for which the user lacks the required permission code are hidden.
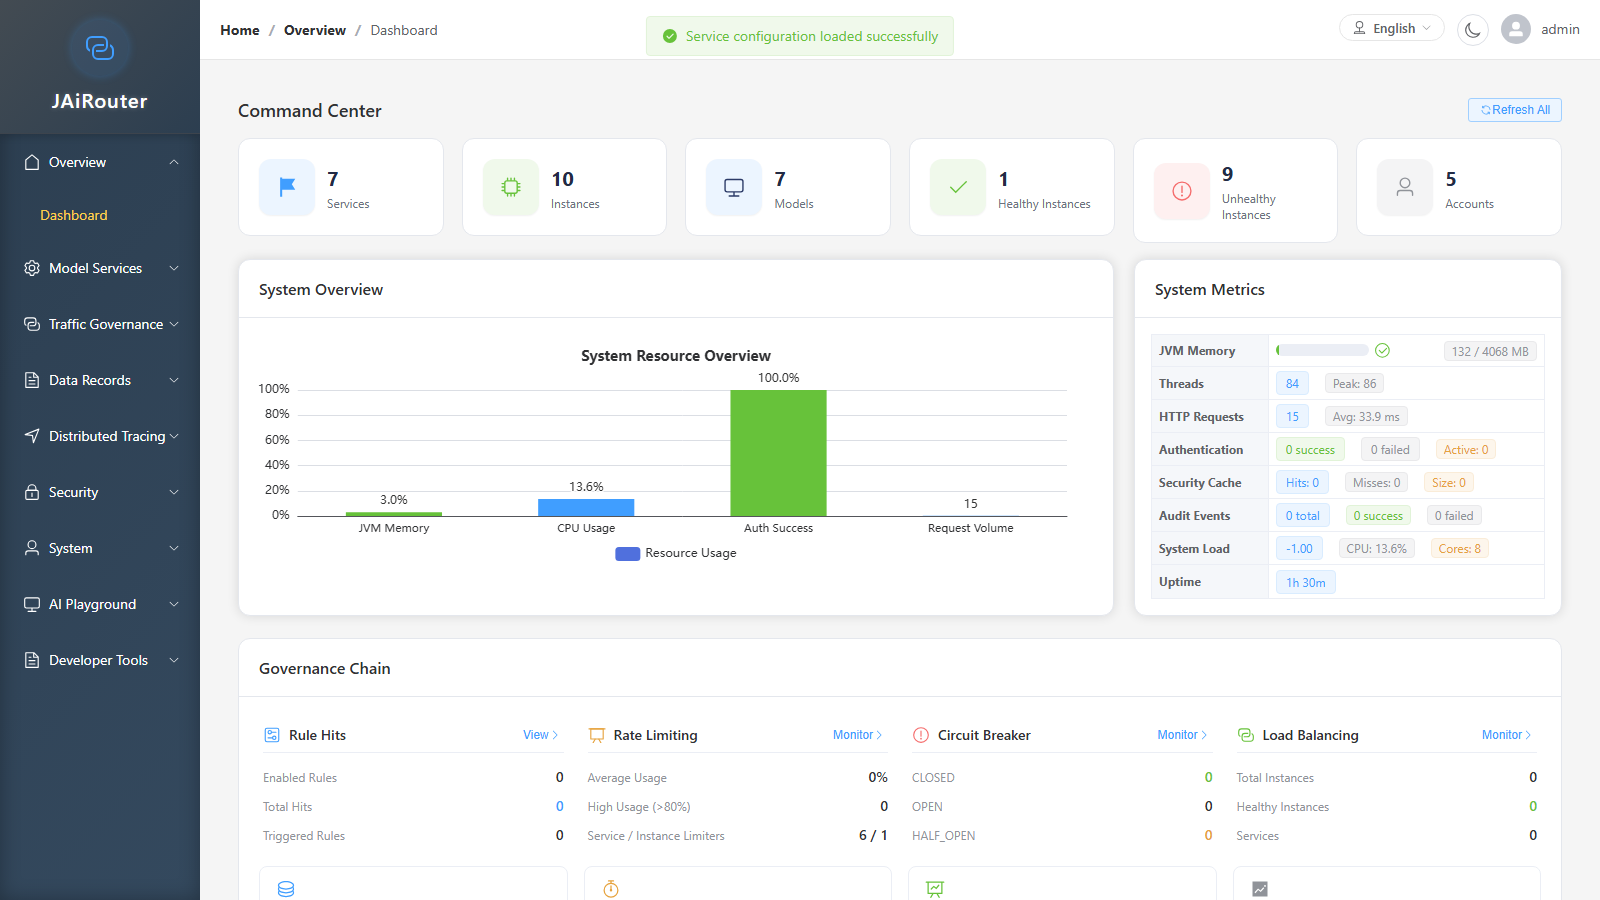
| # | Group (en) | Group (zh) | Pages |
|---|---|---|---|
| 1 | Overview | 概览 | Dashboard |
| 2 | Model Services | 模型服务 | Service Management, Instance Management, Version Management, Adapters |
| 3 | Traffic Governance | 流量治理 | Routing Rules, Load Balancer Monitoring, Load Balancer Strategy, Circuit Breaker Monitoring, Circuit Breaker History, Circuit Breaker Config, Rate Limit Monitoring, Resource Pools, Response Cache Management, Quota Runtime Config |
| 4 | Data Records | 数据记录 | Call History Dashboard, Call List, Token Usage, Slow Calls, Slow Query Analysis, Quota Usage Monitoring, Exception Management, Exception Statistics |
| 5 | Distributed Tracing | 链路追踪 | Tracing Dashboard, Tracing Search, Tracing Config |
| 6 | Security | 安全管理 | API Key Management, JWT Token Management, Blacklist Management, Audit Logs |
| 7 | System | 系统管理 | Account Management, Permission Management, State Persistence |
| 8 | AI Playground | AI 试验场 | Chat Playground, Embedding, Rerank, Audio Service, Image Service |
| 9 | Developer Tools | 开发者工具 | Client Access Guide |
2.2 Top Bar
| Area | Element | Description |
|---|---|---|
| Left | Breadcrumb | Format: Home / Group Name / Current Page |
| Right | Language Switcher | Capsule button with dropdown to select 中文 or English; change takes effect immediately |
| Right | Theme Toggle | Round button with ☀️/🌙 icon to switch between light and dark themes |
| Right | User Menu | Avatar + username (e.g. admin); dropdown contains Profile and Log Out |
2.3 Breadcrumb
The top of the page displays the current navigation path, e.g. Home / Overview / Dashboard. The breadcrumb updates automatically when navigating between pages.
3. Minimum Path to Connect Your First Model Service
The following steps are ordered by dependency, using an Ollama model service as an example.
Step 1: Configure a Service
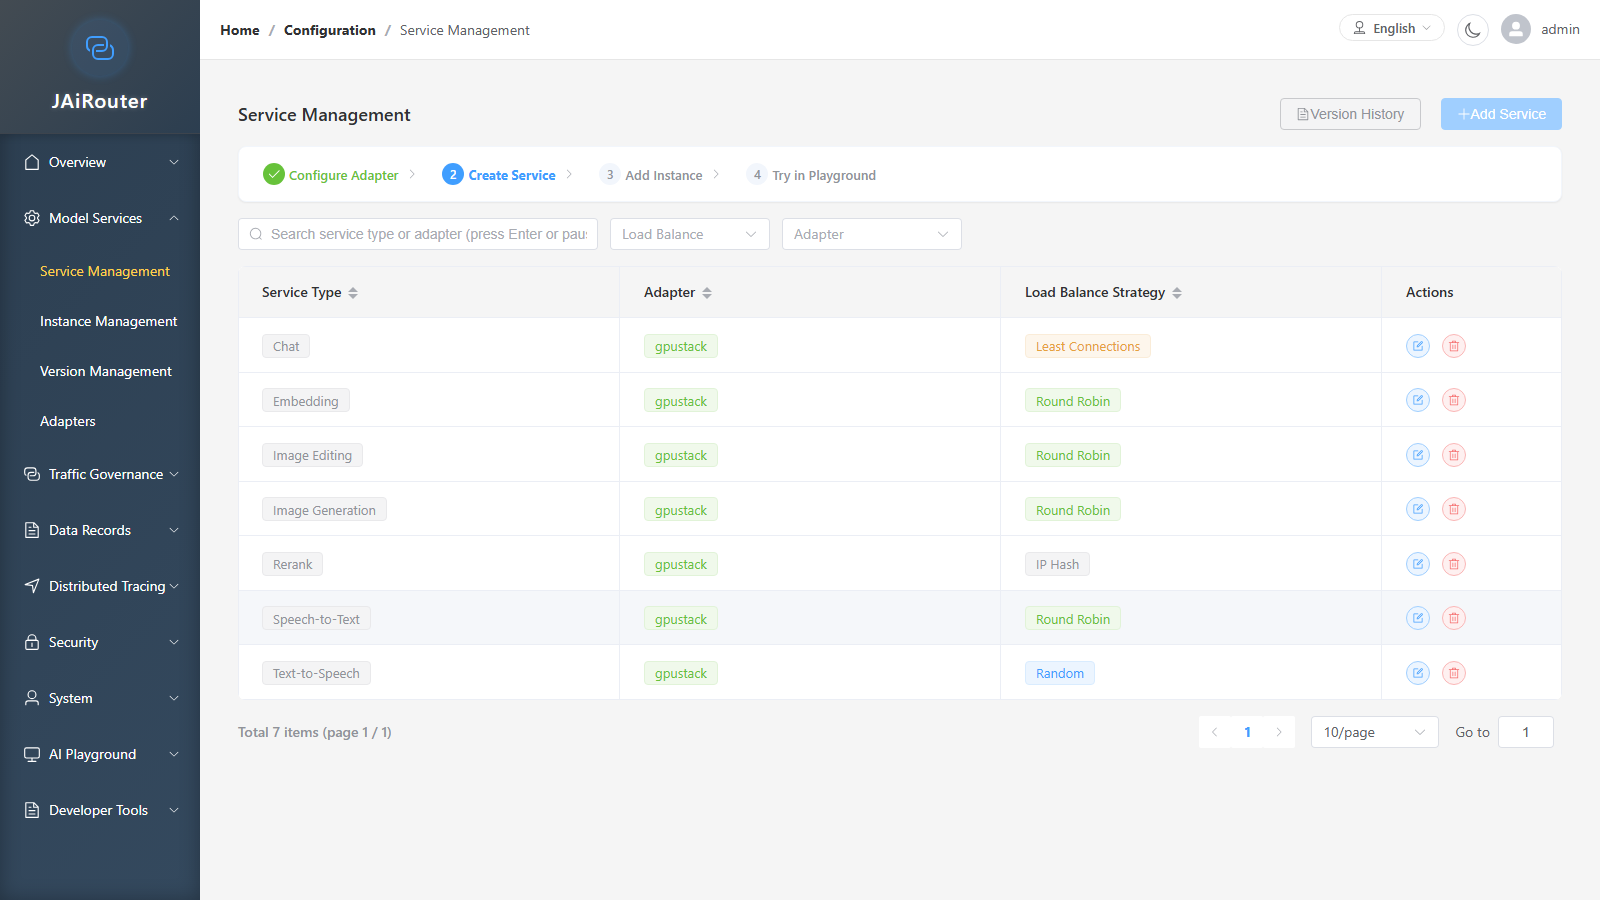
Menu path: Model Services → Service Management
- Go to the Service Management page;
- Click the Add Service button;
- Fill in the form:
| Field | Description | Required |
|---|---|---|
| Service Type | Dropdown selection, e.g. chat, embedding, completion | ✅ |
| Adapter | Dropdown to select the adapter type | ✅ |
| Load Balance Strategy | Random / Round Robin / Least Connections / IP Hash | ✅ |
| Description | Optional note | ❌ |
- Click Save;
- After saving, the service type appears in the list with status Enabled.
Step 2: Configure an Instance
Menu path: Model Services → Instance Management
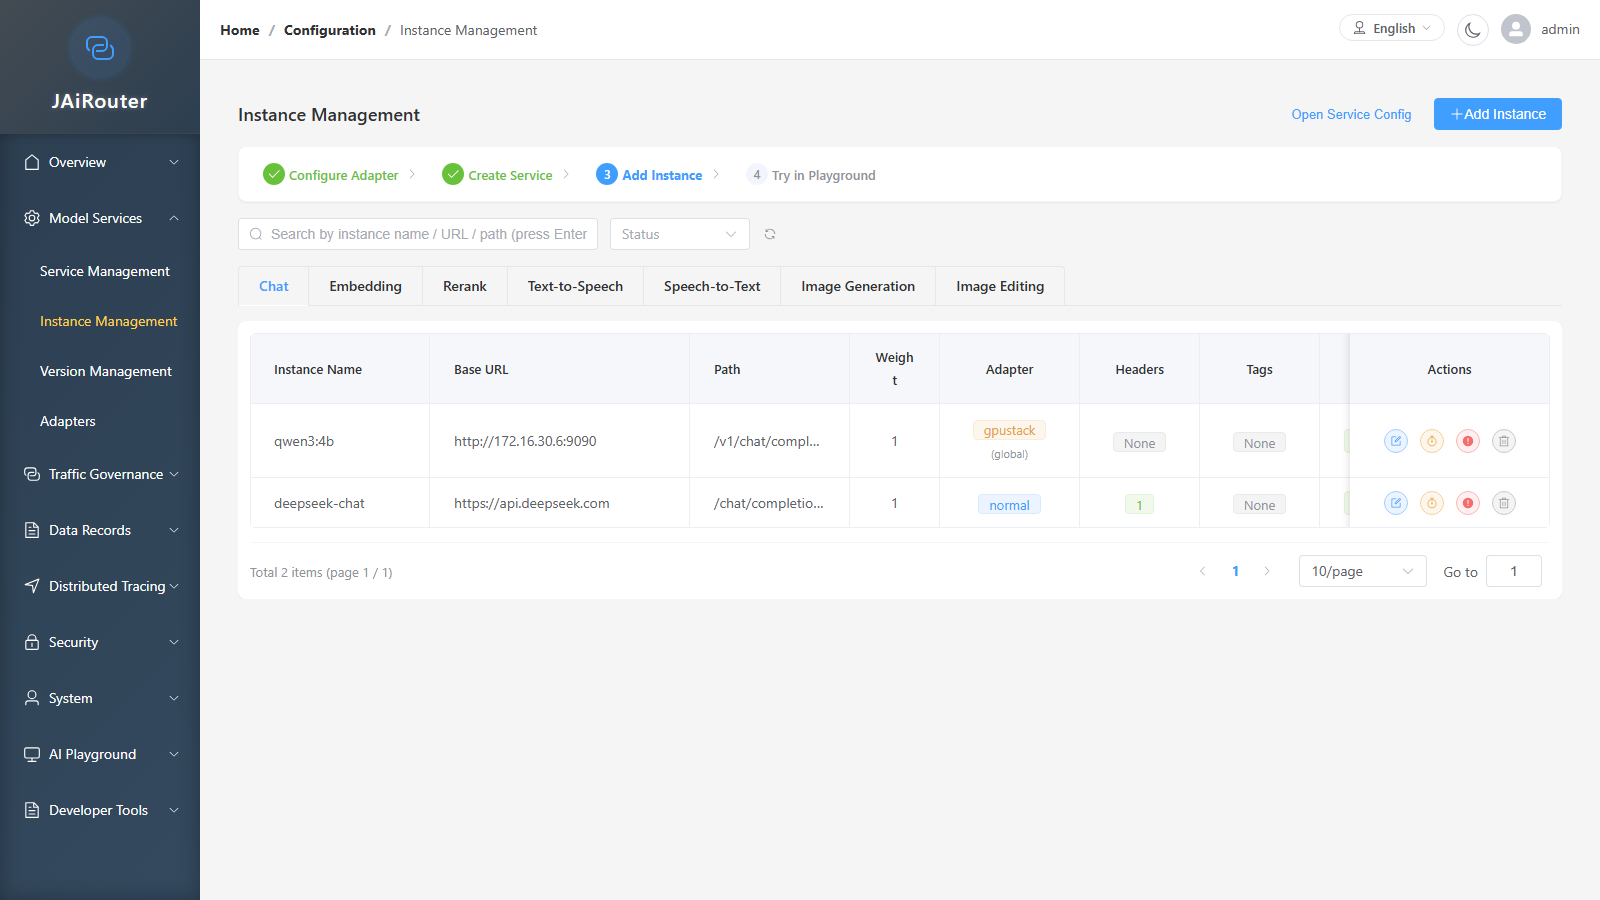
- Go to the Instance Management page;
- Select the corresponding service type from the left dropdown;
- Click the Add Instance button;
- Fill in the form:
| Field | Description | Required | Example |
|---|---|---|---|
| Service Type | The associated service type | ✅ | chat |
| Instance Name | Instance identifier | ✅ | ollama-local |
| Base URL | Downstream service address | ✅ | http://localhost:11434 |
| Path | Request path (optional) | ❌ | /v1/chat/completions |
| Weight | Load balancing weight | ✅ | 1 |
| Adapter | Leave empty to use global config | ❌ | — |
- Expand the Request Header Config section and add headers required by the downstream service:
| Header Name | Header Value | Description |
|---|---|---|
Authorization | Bearer <your-api-key> | Authentication credential transparently forwarded to the downstream model service |
💡 The
Authorizationheader is forwarded transparently to the downstream service — it is not the gateway's own credential. The gateway credential isJairouter_Token(JWT).
- Optional: expand the Tag Config section and add tags for routing rule matching;
- Click Save;
- After saving, the instance appears in the list. The status column shows the health status (healthy/unhealthy).
Step 3: Version and Adapter (If Needed)
- Version Management (Model Services → Version Management): Configure version information if needed. This is not a required step.
- Adapters (Model Services → Adapters): View and manage registered adapters. Skip this step if the adapter was correctly selected in Step 1.
Step 4: Verify Connectivity
After configuration, verify using these methods:
- Dashboard (Overview → Dashboard): Check the "Service Configuration Overview" area to confirm service instance count and healthy instance count;
- Instance Management page: The instance status column should show a green Healthy label (not Unhealthy);
- Load Balancer Monitoring (Traffic Governance → Load Balancer Monitoring): View real-time load balancing status.
Step 5: Test in Playground
Menu path: AI Playground → Chat Playground
- Go to the Chat Playground page;
- Select the model matching the service type configured in Step 1;
- Enter a message and send it;
- If you receive a response, the entire pipeline (Console → Gateway → Model Service) is working.
💡 Playground requires the
ai:playground:usepermission code. Both ADMIN and USER roles have this permission by default.
4. How Quotas Work
4.1 Quota Runtime Configuration
Menu path: Traffic Governance → Quota Runtime Config
The quota feature is disabled by default. To enable it:
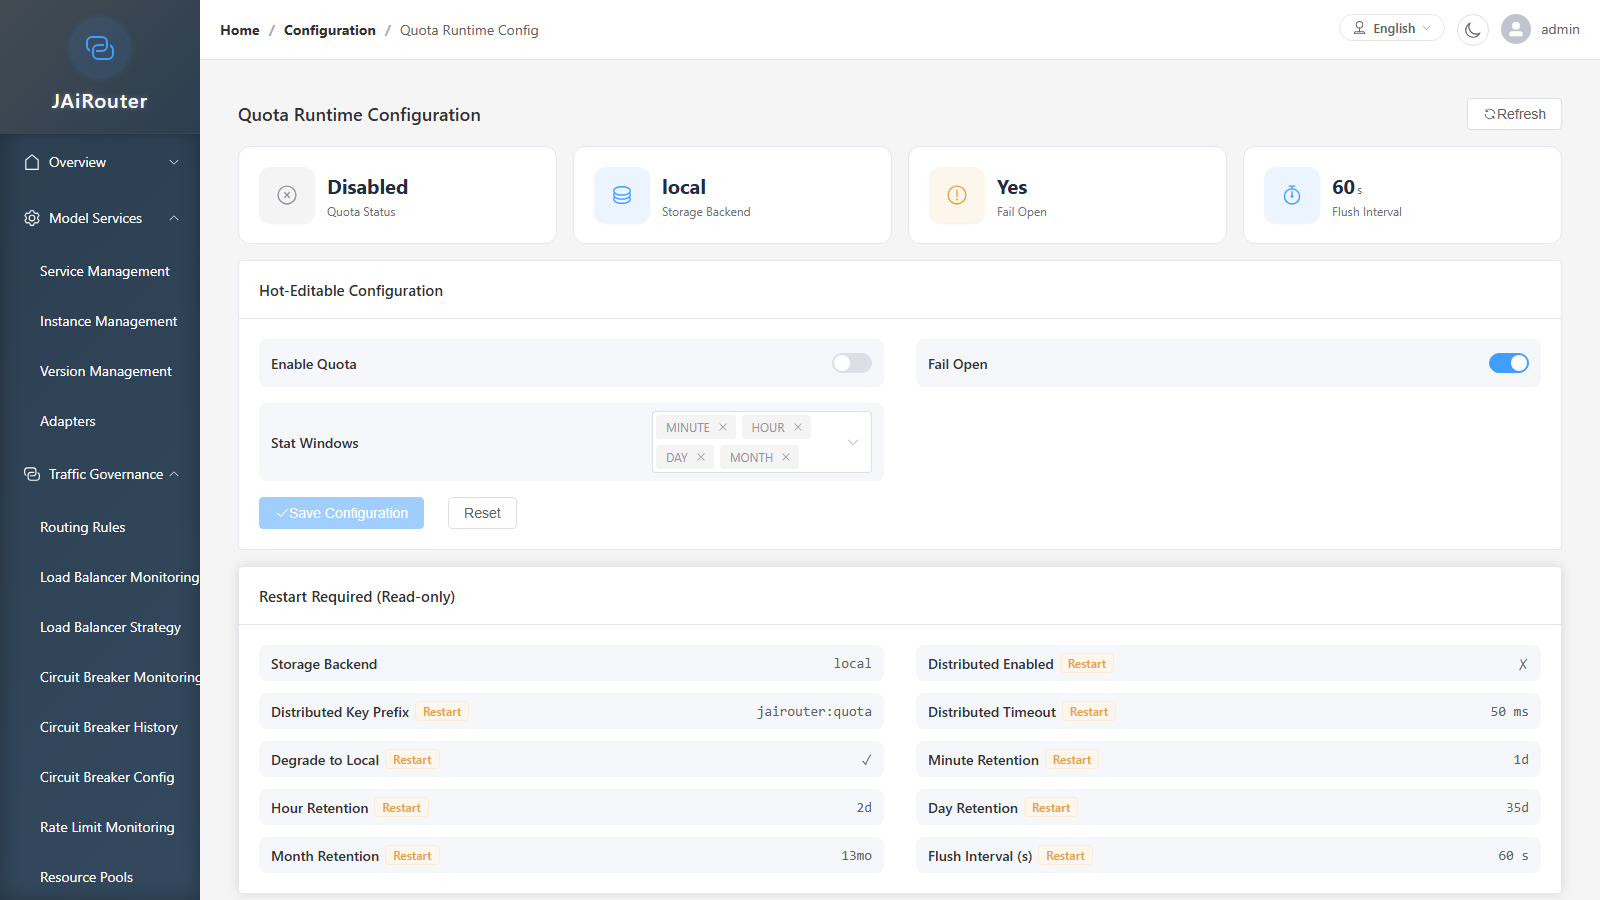
- Go to the Quota Runtime Configuration page;
- Find the Hot-Editable Configuration section;
- Turn on the Enable Quota switch;
- Optional settings:
- Fail Open: whether to allow requests when the quota system is unavailable;
- Stat Windows: select the statistical window dimensions;
- Click Save Configuration.
Hot-editable fields (take effect immediately, no restart):
| Field | Description |
|---|---|
enabled | Enable/disable quotas |
failOpen | Fail-open switch |
windows | Statistical window selection |
Restart-required fields (marked with a Restart badge, read-only):
| Field | Description |
|---|---|
backendName | Storage backend name |
distributedEnabled | Distributed enabled |
distributedKeyPrefix | Distributed key prefix |
distributedTimeout | Distributed timeout |
flushIntervalSeconds | Flush interval |
4.2 Quota Usage Monitoring
Menu path: Data Records → Quota Usage Monitoring
On the Quota Usage Monitoring page you can:
- View quota runtime status: storage backend type, degradation status;
- Filter usage data by Tenant ID / API Key ID / User ID / Service Type / Model / Window;
- View usage details: request count, token count.
💡 If the page displays "Quota ledger not enabled, usage data unavailable", the quota feature is not enabled. Go to the Quota Runtime Config page first to enable it.
5. Observability and Troubleshooting
5.1 Data Records Group
| Page | Path | What It Answers |
|---|---|---|
| Call History Dashboard | /call-history/dashboard | Overall call volume trend, success/failure rate overview |
| Call List | /call-history/list | Detailed record of every request (time, service, status code, latency) |
| Token Usage | /call-history/token-usage | Token consumption per model/service |
| Slow Calls | /call-history/slow-calls | Which requests took too long |
| Slow Query Analysis | /monitoring/slow-queries | Deep analysis of slow requests (requires monitoring:slowquery:read) |
| Quota Usage Monitoring | /monitoring/quota | Quota consumption details |
| Exception Management | /exceptions/list | List of all exception events (visible to all authenticated users) |
| Exception Statistics | /exceptions/statistics | Exception distribution by type/time |
5.2 Distributed Tracing Group
| Page | Path | What It Answers |
|---|---|---|
| Tracing Dashboard | /tracing/dashboard | Trace volume trends, latency distribution, error rate trends, throughput |
| Tracing Search | /tracing/search | Locate specific request traces by Trace ID / service name / time range |
| Tracing Config | /tracing/management | Tracing toggle, sampling rate, exporter configuration (Logging / OTLP / Jaeger) |
5.3 Dashboard Overview
Overview → Dashboard provides a single-pane view:
- System Overview: service count, instance count, healthy instances, unhealthy instances;
- System Metrics: JVM memory, thread count, HTTP requests, CPU usage, uptime;
- Governance Chain: shortcuts to rule hits, rate limiting, circuit breaker, load balancing status;
- Exception / Alert Summary: recent exception event list;
- Service Configuration Overview: global config summary (adapter, rate limit, circuit breaker, etc.).
6. Permissions and Roles
6.1 Four Built-in Roles
| Role | Permission Count | Permission Scope | Description |
|---|---|---|---|
| ADMIN | 48 | All permission codes | Super admin; bypasses URL rules, full codes embedded in JWT |
| OPERATOR | 39 | All :read + :write codes | Day-to-day ops; excludes system management (system:*), security management manage codes (API Key / JWT Token / Blacklist management) |
| USER | 27 | Dashboard + config read + full lb/cb/rl + monitoring read + tracing dashboard/search + AI Playground | Regular user; only write code is lb:config:write |
| VIEWER | 26 | All :read codes | Pure read-only role; no callhistory:view, ai:playground:use, or other non-:read codes |
6.2 Why Some Menu Pages Are Missing
Frontend menu rendering is filtered by permission codes:
- Each menu group/item is associated with a permission code (e.g.
config:services:read); - After login, the JWT's
permissionsclaim contains the current user's permission code list; - The
usePermissioncomposable filters out menu items the user does not have; - The route guard (
meta.permissions) further blocks direct URL access without permissions.
Resolution:
- Go to System → Permission Management (requires
system:permissions:manage, ADMIN only); - Find the target role, check the missing permission codes, and save.
💡
/v1/**(OpenAI-compatible inference endpoints) is independent of the RBAC system and only requires authentication — it is not restricted by permission codes.
7. Multi-Protocol Access
7.1 Client Access Guide
Menu path: Developer Tools → Client Access Guide
This page provides complete access examples for the OpenAI-compatible API and the Anthropic-compatible API, including Base URL, authentication method, curl examples, and SDK examples.
7.2 Credential Header Specifications
| Protocol Surface | Credential Header | Description |
|---|---|---|
| OpenAI-compatible | X-API-Key: <Gateway API Key> | Used for /v1/* endpoints |
| Anthropic-compatible | x-api-key: <Gateway API Key> | Used for the Anthropic Messages API |
| Console | Jairouter_Token: <JWT> | Management API credential after Web Console login |
Authorization | — | Forwarded transparently to the downstream model service; not a gateway credential |
⚠️ The
Authorizationheader (e.g.Bearer <token>) is forwarded as-is to the downstream model service by the gateway — it is not used as the gateway's own authentication credential.
8. Common Issues
8.1 401 After Login
Symptom: API requests return 401 Unauthorized after logging in.
Possible causes:
- The JWT has expired (default validity is 60 minutes);
- The
JWT_SECRETenvironment variable is inconsistent across restarts, causing token signature verification to fail.
Resolution:
- Log in again to obtain a new token;
- Verify that the
JWT_SECRETenvironment variable has not changed after a restart.
8.2 403 After Login
Symptom: Some APIs return 403 Forbidden.
Possible cause: The current user's role lacks the required permission code.
Resolution:
- Log in with the
adminaccount, go to System → Permission Management, and add the missing permission code to the role; - See the RBAC Permission Management documentation for details on the permission code system.
8.3 Missing Menu Pages
Symptom: After logging in, some menu groups or pages are missing from the sidebar.
Possible cause: The current user's role does not include the permission code for the corresponding menu item.
Resolution:
8.4 OpenAI SDK Integration Error
Symptom: Using the OpenAI SDK returns 401.
Possible cause: The SDK defaults to using the Authorization: Bearer <key> header rather than X-API-Key. The gateway's OpenAI-compatible endpoint requires the X-API-Key header for API Key authentication.
Resolution:
- Use the
X-API-Keyheader instead ofAuthorizationto pass the API Key; - See the SDK example on the Developer Tools → Client Access Guide page.
8.5 Redis Unavailable Degradation
Symptom: The dashboard or monitoring pages show connection errors.
Possible cause: When JAiRouter uses Redis for JWT persistence or distributed quota storage, Redis is not started or is unreachable. In local development, Redis is disabled by default (redis.enabled: false), and JWT uses H2 + memory fallback.
Resolution:
- Local development: No Redis needed — JWT uses H2 storage with memory fallback, and functionality is unaffected;
- Production: Ensure Redis is available, or configure
jairouter.security.jwt.persistence.fallback-storage: memory.
8.6 Quotas Not Taking Effect
Symptom: After sending requests, the Quota Usage Monitoring page shows no data.
Possible cause: The quota feature is disabled by default.
Resolution:
- Go to Traffic Governance → Quota Runtime Config;
- Enable the quota switch and save;
- Verify the storage backend status is normal (not degraded).
Appendix: Page Path Quick Reference
| Group | Page | Route Path |
|---|---|---|
| Overview | Dashboard | /dashboard/main |
| Model Services | Service Management | /config/services |
| Model Services | Instance Management | /config/instances |
| Model Services | Version Management | /config/versions |
| Model Services | Adapters | /config/adapters |
| Traffic Governance | Routing Rules | /config/rules |
| Traffic Governance | Load Balancer Monitoring | /load-balancers/monitoring |
| Traffic Governance | Load Balancer Strategy | /load-balancers/strategy-config |
| Traffic Governance | Circuit Breaker Monitoring | /circuit-breakers/monitoring |
| Traffic Governance | Circuit Breaker History | /circuit-breakers/history |
| Traffic Governance | Circuit Breaker Config | /circuit-breakers/global-config |
| Traffic Governance | Rate Limit Monitoring | /rate-limiters/monitoring |
| Traffic Governance | Resource Pools | /config/pools |
| Traffic Governance | Response Cache Management | /config/cache |
| Traffic Governance | Quota Runtime Config | /config/quota |
| Data Records | Call History Dashboard | /call-history/dashboard |
| Data Records | Call List | /call-history/list |
| Data Records | Token Usage | /call-history/token-usage |
| Data Records | Slow Calls | /call-history/slow-calls |
| Data Records | Slow Query Analysis | /monitoring/slow-queries |
| Data Records | Quota Usage Monitoring | /monitoring/quota |
| Data Records | Exception Management | /exceptions/list |
| Data Records | Exception Statistics | /exceptions/statistics |
| Distributed Tracing | Tracing Dashboard | /tracing/dashboard |
| Distributed Tracing | Tracing Search | /tracing/search |
| Distributed Tracing | Tracing Config | /tracing/management |
| Security | API Key Management | /security/api-keys |
| Security | JWT Token Management | /security/jwt-tokens |
| Security | Blacklist Management | /security/blacklist |
| Security | Audit Logs | /security/audit-logs |
| System | Account Management | /system/accounts |
| System | Permission Management | /system/permissions |
| System | State Persistence | /config/state-persistence |
| AI Playground | Chat Playground | /playground/chat |
| AI Playground | Embedding | /playground/embedding |
| AI Playground | Rerank | /playground/rerank |
| AI Playground | Audio Service | /playground/audio |
| AI Playground | Image Service | /playground/image |
| Developer Tools | Client Access Guide | /tools/client-access |